Gaining Business Awareness: The Six-Step Method for Efficient Data Administration
Making wise business decisions requires managing the data in your company. Learn about the advantages of data management and the six-step method for producing real-time insights.
Why Is Managing Data Critical?
Your company has a number of internal data sources that you can employ, in addition to external sources that can offer more information to help you assess how successfully you’re managing your company. You must manage the data efficiently to “choose the fruit” at the ideal moment—not too early, when the data is raw, nor too late when it is no longer fresh. Merely having access to data is inadequate.
In order to enable data analysis for business decision-making, data management includes gathering, organizing, storing, transforming, visualizing, sharing, regulating, and safeguarding your organization’s data.
The capacity to generate reports that pull from various record-keeping systems and reconcile disparate data schemas is another prerequisite for efficient data management. Furthermore, in order to manage new data sources and existing sources with growing data volumes, you must be able to quickly extend your data-gathering capabilities.
In addition, maintaining consistent data security is necessary to guard against the loss of important firm data. While preventing illegal access is crucial, you also want to give authorized users self-service data analysis tools that make it simple to find insights even if they lack analytical training. Your internal teams probably don’t have the time to become familiar with complex procedures, but they nevertheless need to provide solutions quickly.
The Advantages of Data Management
When you take into account the advantages of efficient data administration that give your KPI owners individualized reports, overcoming these obstacles is definitely worth the work. By adding advanced analytics to your systems of record, you can get complete views of your company processes and real-time insights.
Artificial intelligence (AI), which provides you with 360-degree views of how successfully your organization and its processes operate, can also help you produce deeper insights. Furthermore, AI is able to offer prescriptive and predictive recommendations when it has a strong database.
By merging data exploration, insights, and integrated governance, you can optimize the business value of the data and do rid of isolated data silos while scaling analytics across all of your data sources. Teams can investigate large data sets more quickly and get the solutions they need to operate your business more effectively.
Support on Your Path Towards Data Management
Data collection alone does not equate to data that supports business. Bringing the data together and using it to its fullest extent can be a difficult process. The quantity and quality of business insights that you can derive from efficient data management are directly correlated with the quantity of interrelated data sources.
Answer this: Is it possible to connect social media sentiment data about products with transactional sales data? Can you produce precise insights and use both favorable and unfavorable product sentiments in your marketing and sales strategies? Is it possible to use manufacturing data straight from IoT sensors to enhance design or production?
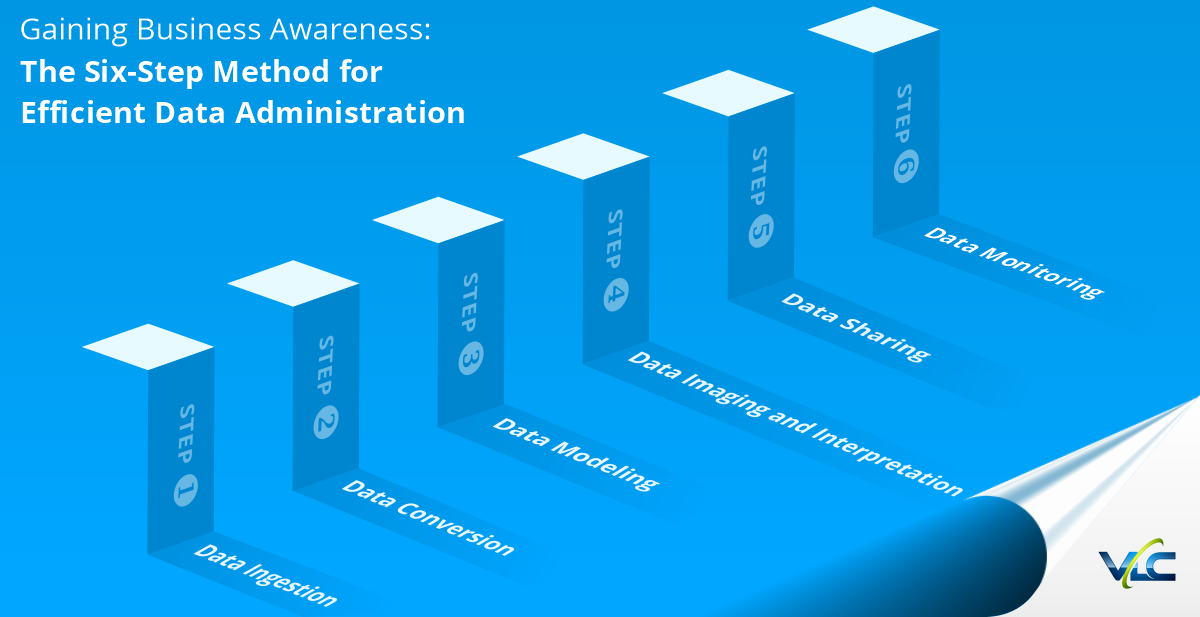
In order to facilitate your journey toward efficient data management, this document outlines a six-step process for producing insights that inform business decisions.
Step 1: Data Ingestion
Step 2: Data Conversion
Step 3: Data Modeling
Step 4: Data Imaging and Interpretation
Step 5: Data Sharing
Step 6: Data Monitoring
We also look at the ways that you can develop data repositories, pipelines, models, reports, dashboards, and workflows using different technologies. When properly implemented, each of these components of the larger data management system will contribute to your business by boosting sales, cutting expenses, and enhancing the efficiency of employees.
It’s possible for your company to get a lot of data from several sources. However, it might be challenging to make full use of that data if the sources are disconnected, especially as your company expands. Every transactional system’s analytics have restricted reporting options right out of the box.
It’s also possible that you have implemented an ERP system in addition to other business apps to help with operations, marketing, and sales. You must extract the data, ingest it into a centralized data lake, and then enhance the data—where a program can produce more advanced reports—in order to take advantage of the synergy that results from merging multiple data sources. Connecting more data sources increases the potency of those insights.
Step 1:
Data Ingestion
Mere data collection is not enough. The first step in helping your business boost income, cut expenses, and improve worker productivity is implementing a procedure for correctly digesting the data.
Creating a method that maximizes the speed at which data loads is one of the keys to data intake, which is the first stage of the data management lifecycle. Finding a balance between loading and querying the data is necessary for this. Because end users require quick insights, many companies concentrate on query speed. However, the downstream processes may be impacted if the data loading procedure is laborious and inefficient.
Step 2:
Data Conversion
A set of guidelines will be followed by each data source feeding into your data management system regarding which record fields to use and how to insert data into them. In other circumstances, the fields and regulations will be different, but they will still be the same. Incorrect data entry or the necessity to complete a record field are other scenarios that may arise. Because of all of this, data that comes from various information sources needs to be cleaned. You can only produce reliable business insights after that.
The Three Data Conversion Layers:
Errors are found and fixed during data cleansing, which also reconciles data records. It is likely that you will preserve data sets over three transformation levels when you set up your cleansing process:
- Raw Layer: Unprocessed data stored
- Curated Layer: Data purification begins
- Aggregated Layer: Use of business rules
Raw Layer
After being ingested from each data source, the data is centralized and kept in its original form in the raw layer, also referred to as the bronze layer. You can now access the data from several sources in one location, but there is still no clean-up to be done. When source systems are discontinued, or you need to come back to the original data after cleansing—which takes place in the next two layers—this comes in handy. Additionally, historical point-in-time copies of your raw data are preserved. However, not everyone should have access to this raw layer. Since technical expertise is needed to access the data and you want to make sure it is never tampered with, it is typically restricted to developers.
Curated Layer
Data cleansing begins at the curated layer, sometimes referred to as the silver layer. Duplicate data fields are eliminated or reconciled, and missing data entries are updated or erased. Additionally, you can sort out multiple versions of a field—rows reflecting the same record are consolidated into a single record—and fix misspellings. Additionally, cleaning establishes the one source of truth required for precise analysis and verifies the data that is pertinent for analysis. The field is changed to the proper data type for any invalid data, such as a field that should include letters but instead contains integers. The curated layer may also involve other changes like splitting, combining, adding, renaming, and analyzing columns. Data scientists and business analysts typically manage the data at this layer.
Aggregated Layer
The ultimate stage of data transformation, referred to as the “gold layer” or aggregated layer, is where business rules are applied. For instance, you may determine that two tables with the same structure need to be appended or merged. Additionally, you might want to aggregate (sum) the fields in a table. This will help the analysis step run more smoothly and produce more insightful data. Subject matter specialists and data scientists—users who comprehend your company’s operations—usually handle data at this level.
Typically, a single data lake houses all three levels of storage. The data lake makes it simpler to go back and retrieve data from the Curated Layer or the Raw Layer when a report requires more specificity.
Step 3:
Data Modeling
The next stage is to construct data models to produce the appropriate reports after ingesting data from your various data sources, converting the data, and then analyzing it. In order to achieve the ideal balance between the reporting granularity and the analysis’s performing speed, you must also optimize the models.
Phase 1: Creating the Data Model
Tables having multiple columns, such as a list of clients, goods, or suppliers, make up a data model. Columns such as firm name, principal contact, and address may be found in a client table. A vendor table can include contact information and a list of the products that each vendor offers, but a product table might have columns that display the features or specifications of each product.
The cardinality of the relationship between the tables is another key idea in model design. One-to-one or one-to-many relationships are possible. A product group with numerous items is an example of a one-to-many relationship. One state might have numerous cities and towns, or one brand could have a large number of items.
Phase 2: Constructing the Information Model
Upon creating a data model’s foundational components, you will typically find that more functionality has to be built. To get the overall revenue, you may want to include a column that multiplies the product price by the quantity sold. Adding dimension hierarchies to a model is another method to improve it. Think of a product category that consists of numerous items under a single brand.
Days within several weeks, weeks within months, and months through years make up the date hierarchy. This kind of hierarchy enables drill-down analysis. Once you have a year’s worth of sales data, you can examine a particular month, the second week, and ultimately, a single day. Geographical topologies (city, state, region, country) can also be defined.
Apart from computed tables and hierarchies, row-level security is another crucial idea. This relates to how visible the data is in a particular row and is determined by the role of each individual viewing the data. The sales manager may only get an overview of each representative’s territory, but they can still drill down to the level of detail that each sales representative completed. In contrast, a sales representative could view every row of sales they completed.
Role-Based Access Control (RBAC) is another option. Sales representatives are able to view their own territory rather than those of their peers. The permitted data is shown by the system based on its detection of each user’s function.
Phase 3: Formulating Indications and Measures
In many cases, the data is insufficient on its own when creating data models. You’ll have to integrate measurements (calculations) across several domains. You may, for instance, compute revenue targets and actuals for particular time periods.
Phase 4: Improving Model Performance
As previously noted, one important optimization method is the star schema. Eliminating superfluous rows and columns is another recommended approach. Your first instinct when using data sources may be to use every bit of information available, but depending on the study you intend to perform, that may not always be the case.
It is preferable to begin with the fewest rows and columns required to create a report in order to enhance performance. You can always go back and add more rows or columns if needed. It is usually advisable to divide a table into product groups if it is too large, such as a product table with thousands of products, as this will enhance the performance of the analysis.
Step 4:
Data Imaging and Interpretation
Once your data has been ingested, transformed, and modeled, you can start bringing it to life to solve business problems and take advantage of opportunities through visualization and analysis.
Most of the time, analysis is forward-looking, predictive, and normative (what will happen and what to do about it), while visualization looks back retrospectively and is descriptive and diagnostic (what happened and why). Certainly, you can create visualizations that look forward and examine past data to identify trends and patterns.
Accuracy and speed are two essential components of analysis and visualization. Business executives are able to make judgments when there is still time to make adjustments when data is delivered in real-time or right after some time (day, week, or month) ends. Information received a week or a month after the fact is useless. The data’s continuous accuracy is also crucial. Users won’t feel confident using the data to make judgments until then.
Visualizations: Beyond Vibrant Pie Charts
Generating vibrant charts is one of many aspects of data visualization. The images ought to convey a narrative. In order to provide managers and executives with the precise information they require to make business decisions, they should also have significance for them.
Sometimes, businesses choose to use charts and graphs to display all of the data that is accessible. Giving decision-makers access to a wealth of data might be beneficial, but only if it helps them understand the events that have occurred within the company and their causes.
Working with users to identify the essential data points and beginning with the smallest amount of data points to tell a succinct story can help you produce useful visualizations. An example would be when financial analysts require transaction-level details and prefer to see data in tables with rows and columns. But that degree of specificity is unnecessary for an executive. Another kind of vision, such as a waterfall, column, or bar chart, is more appropriate because it shows the larger picture that influences their choices.
Using AI-Driven Analysis to Go Deeper
The analysis is more in-depth than visual aids. Here’s where you can improve reports to provide insights and spot patterns and trends, which can help business executives forecast results more easily. Artificial intelligence is a major component of analysis (AI). AI assistance used to require hiring data experts, but these days, it’s simpler because certain features automate machine learning. This facilitates pattern recognition and forecasting.
Step 5:
Data Sharing
The outputs of building dashboards and reports with dataflows and datasets are more valuable since they are readily shared and distributed to departments, teams, or the entire organization. Information sharing promotes teamwork and helps people get the knowledge they need to manage operations more successfully.
Working together using data intelligence is one method. Colleagues can develop sets of dashboards and reports that can be accessed by many teams and people by setting up workspaces with central repositories. All of the dashboards and reports are kept in one location that authorized individuals may access. It is possible to grant administrator, viewing, or editing rights to each individual.
Promoting Cooperation on Several Fronts
When employees save reports to their desktops and keep them private, this collaborative approach breaks down data silos inside your company. Users do not need to rebuild datasets and data transformation procedures (see Step 3) when creating new reports once they have stored and shared datasets in a workspace. By doing this, redundant dashboards and reports are avoided, which could result in several, possibly contradicting sources of accurate information.
Users can also create new reports using the same data sources and data transformation flows by utilizing the work that has already been completed by others. Using the same artifacts, this method confirms comparisons with other reports.
Any report that hooks into such artifacts can be affected generically by changes made to a data source or flow at any time. Notification will be sent to all report owners, allowing them to confirm that the modifications are appropriate. In this way, team members can easily collaborate while carrying out tasks and when managing dashboards and reports.
Step 6:
Data Monitoring
You can begin to appreciate the actual value of the data once you have effectively finished the first five steps of managing your data to produce insightful business decisions. Your essential data sources are connected to you, and you can use that data to create useful dashboards and reports.
You must now guarantee that all of that data is used appropriately if you want to make sure your journey remains successful. Here are the five components of governance that are relevant:
1 – Make an Integrated Data Map Throughout Your Data Estate
Data is difficult to use if people are unaware of its locations and the kinds of information it contains from different sources. You can provide users with information about all of your on-premises, cloud, and SaaS sources’ data sources and report sets by generating a data map. Four categories of metadata must be captured by the map in order for users to understand the data:
The data schema, data types (text, numeric, and date), and column titles of each table are all communicated through technical metadata.
• Business metadata, which comprises a dictionary of terms explaining each term’s precise meaning and importance to the company, is frequently generated from SQL table data sets (such as those containing customers, products, and bills).
• Data sources are related to semantic metadata. What is the source of the data, and how is it categorized?
• Data tasks, such as the manner in which the data was created and when it was viewed, are displayed by operational metadata.
Classifying data is very crucial for regulatory compliance. This is how personally identifiable information and other sensitive data are labeled. You may show how you protect data and that you are aware of where it is being stored by classifying the data.
2-Make Your Information Accessible
It can be difficult for consumers to find specific information with all the data sources your company uses and the numerous reports and dashboards you create. By offering a data catalog that enables users to peruse and look for data using technical or business terminology, you can get around this problem.
In the end, the data discovery process gives users the information they require for analytics and the development of machine-learning algorithms, including data scientists, engineers, and analysts. They may be aware of how the company runs, but it could be challenging for them to locate the precise information they require to address business issues.
Data lineage, or tracking the path of data from its original source to reports and dashboards, is another essential component of discovery. Knowing the origin of data is especially crucial when it comes from a legacy system that isn’t utilized very often. When attempting to resolve data inconsistencies, it is equally critical to ascertain the source.
3-Calculate Data Usage
You must know who makes use of your data outputs, how often they are used, and how those insights aid in decision-making in order to calculate the return on investment (ROI) of your data insights projects. In order to make any necessary adjustments, you should also be aware of how effectively your data sources and data types function.
In the event that an underutilized data source is discovered, the question becomes. Why? Are the data helpful? Is the information searchable and inventoried? Is it in the right category? Is there a designated person in charge of data curation? A data source may not provide value if there is an imbalance in any one of these areas.
A data source may thrill your firm, leading to requests for numerous reports. However, you won’t receive a return on your investment if no one consumes the reports you provide once the initial enthusiasm subsides and they are generated.
4-Sharing Information Without Making Duplicates
Data duplication and inconsistent versions are avoided when it is centrally stored as opposed to being kept in separate silos. The secret to enhancing the value of insights is to share them; the greater the number of individuals aware of the data, the more decisions and workflows the knowledge impacts.
Additionally, consider sharing data with partners, customers, and market analysts, as well as with people outside of your company. Sharing with outside parties can be beneficial even though there will be fewer limitations on accessibility and what people can view. Working together can help you generate synergies that result in new goods and services.
5-Manage Access
In order to share the appropriate data with the appropriate people, you should now take into account who has access to which data sets. This part entails establishing the rules that permit data engineers to grant access to data assets in accordance with consent from data owners.
Your internal rules must be followed by the access control policies you establish, and any regulations that apply to sensitive data you manage must also be followed. You might be required by some requirements to keep an eye on compliance and to periodically evaluate your policies to make sure they stay compliant. You will occasionally also need to appoint a third-party, independent auditor to verify your compliance.
Maintaining Focus on Your Insights
With the help of this six-step approach, you can now more quickly and effectively make business decisions by generating insightful data. This is a journey that you will probably take on multiple times as you pinpoint the different aspects of your company where better decision-making is required.
Every field will require different data sources to be ingested, as well as different modeling, transformation, visualization, and analytic needs. Additionally distinctive will be the methods by which internal teams work together and manage the data.
Additionally, after you set up a procedure for producing data insights, you must continually assess each of the six processes. The methods required to make sure your insights stay on target will also need to adapt as data sources and business requirements do.
VLC Solutions is available to assist you with managing the data in your organization so that it can produce insightful business analyses. Speak with us right now to find out more about our solutions and how they may assist you in gathering, evaluating, and managing your data.